
CAT 2019Slot 2DILRQuestion & Solution
Data Set
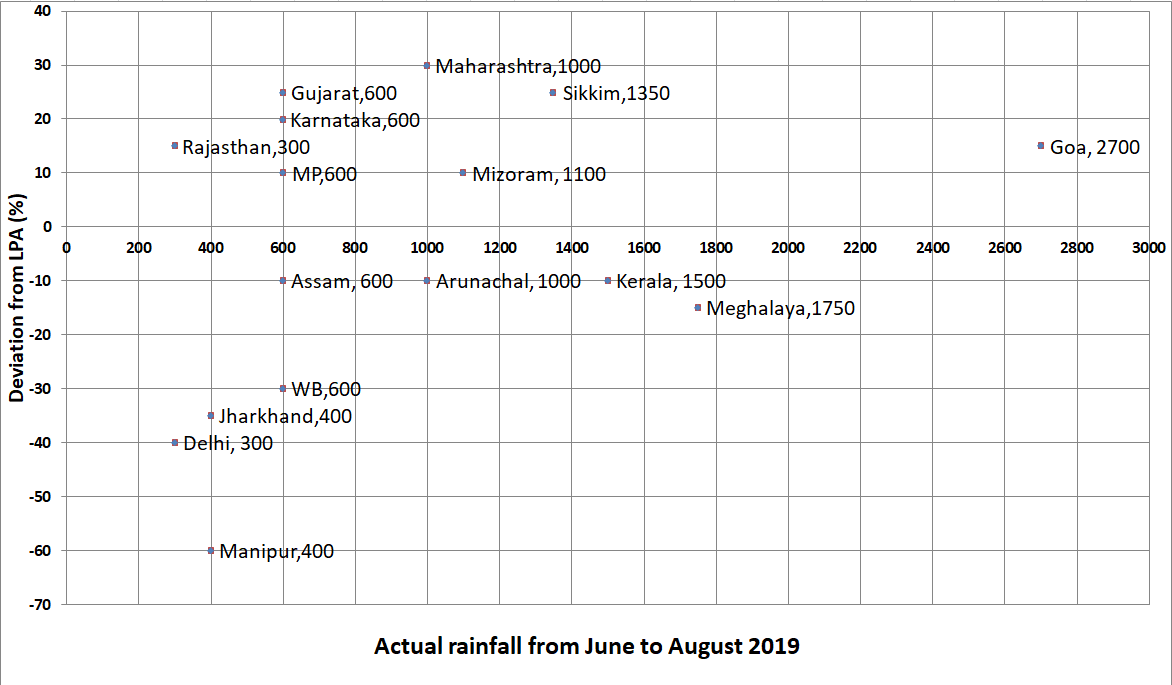
To compare the rainfall data, India Meteorological Department (IMD) calculated the Long Period Average (LPA) of rainfall during period June-August for each of the 16 states. The figure given below shows the actual rainfall (measured in mm) during June-August, 2019 and the percentage deviations from LPA of respective states in 2018. Each state along with its actual rainfall is presented in the figure.
Question 1
If a ‘Heavy Monsoon State’ is defined as a state with actual rainfall from June-August, 2019 of 900 mm or more, then approximately what percentage of ‘Heavy Monsoon States’ have a negative deviation from respective LPAs in 2019?
42.86
75.00
57.14
14.29
Solution:
The states which satisfy the condition given in the question:
Maharashtra, Mizoram, Sikkim, Goa, Arunachal, Kerla, Meghalaya.....7 states
The ‘Heavy Monsoon States’ have a negative deviation: Arunachal, Kerla, Meghalaya
= 3/7x100=42.86%
Option A
Question 2
If a ‘Low Monsoon State’ is defined as a state with actual rainfall from June-August, 2019 of 750 mm or less, then what is the median ‘deviation from LPA’ (as defined in the Y-axis of the figure) of ‘Low Monsoon States’?
-10%
10%
-20%
-30%
Solution:
All the states which satisfy the condition for ' Low monsoon state' are Gujrat (+25%), Karnataka (+20%), Rajasthan (+15), MP (+10%), Assam (-10%), WB (-30%), Jharkhand (-35%), Delhi (-40%) and Manipur (-60%).
The median of all the deviation is -10% Assam.
Question 3
What is the average rainfall of all states that have actual rainfall of 600 mm or less in 2019 and have a negative deviation from LPA?
367 mm
500 mm
450 mm
460 mm
Solution:
The states Assam, WB, Jharkhand, Delhi and Manipur satisfy the conditions given in the question.
The actual rainfall of all these states in 2019 are 600,600,400,300,400
Average of these states= 2300/5=460mm
Question 4
The LPA of a state for a year is defined as the average rainfall in the preceding 10 years considering the period of June-August. For example, LPA in 2018 is the average rainfall during 2009-2018 and LPA in 2019 is the average rainfall during 2010-2019. It is also observed that the actual rainfall in Gujarat in 2019 is 20% more than the rainfall in 2009. The LPA of Gujarat in 2019 is closest to
475 mm
505 mm
490 mm
525 mm
Solution:
The actual rainfall in Gujarat in 2019 is 20% more than the rainfall in 2009.
So If the actual rainfall in 2009 = x mm
Then the actual rainfall in 2019= 1.2x mm
Actual rainfall in 2019= 600mm
Then, actual rainfall in 2009 = 500mm
As deviation is +25% so average 2009 - 2018 is 600/1.25 = 480
LPA 2019 = (480×10 - 500 + 600 )/10 = 490mm
Answer C