
CAT 2019Slot 2DILRQuestion & Solution
Data Set
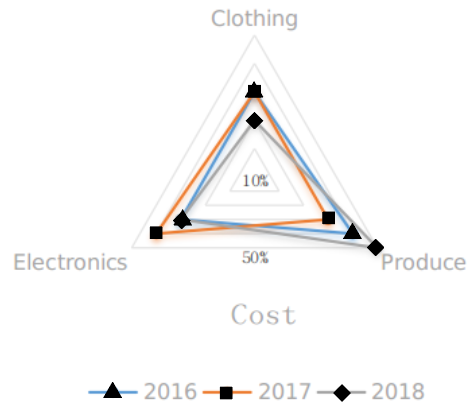
A large store has only three departments, Clothing, Produce, and Electronics. The following figure shows the percentages of revenue and cost from the three departments for the years 2016, 2017 and 2018. The dotted lines depict percentage levels. So for example, in 2016, 50% of store's revenue came from its Electronics department while 40% of its costs were incurred in the Produce department
In this setup, Profit is computed as (Revenue - Cost) and Percentage Profit as Profit/Cost × 100%.
It is known that
1. The percentage profit for the store in 2016 was 100%.
2. The store’s revenue doubled from 2016 to 2017, and its cost doubled from 2016 to 2018.
3. There was no profit from the Electronics department in 2017.
4. In 2018, the revenue from the Clothing department was the same as the cost incurred in the Produce department.
Question 1
What was the percentage profit of the store in 2018?
Solution:
We can make the following table from the web chart given in the question:
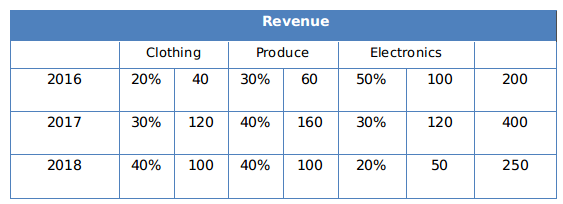
If we consider the total cost in the year
2016 as 100, then according to Statement 1, the total revenue in 2016 must be 200.
The store’s revenue doubled from 2016 to 2017, thus the total revenue in the year 2017 = 400.
We can find the revenue for the individual department in the year 2017, from the table.
There was no profit from the Electronics department in 2017, thus, we can find the total cost in 2017= 300
Considering the statement 4, we can find the total revenue in 2018 and tabulate the following table.
The percentage profit of the store in 2018= (250-200)/200= 25%
Question 2
What was the ratio of revenue generated from the Produce department in 2017 to that in 2018?
16 : 9
4 : 3
9 : 16
8 : 5
Solution:
We can make the following table from the web chart given in the question:
If we consider the total cost in the year
2016 as 100, then according to Statement 1, the total revenue in 2016 must be 200.
The store’s revenue doubled from 2016 to 2017, thus the total revenue in the year 2017 = 400.
We can find the revenue for the individual department in the year 2017, from the table.
There was no profit from the Electronics department in 2017, thus, we can find the total cost in 2017= 300
Considering the statement 4, we can find the total revenue in 2018 and tabulate the following table.
The ratio of revenue generated from the Produce department in 2017 to that in 2018 = 160:100= 8:5
Question 3
What percentage of the total profits for the store in 2016 was from the Electronics department?
Solution:
We can make the following table from the web chart given in the question:
If we consider the total cost in the year
2016 as 100, then according to Statement 1, the total revenue in 2016 must be 200.
The store’s revenue doubled from 2016 to 2017, thus the total revenue in the year 2017 = 400.
We can find the revenue for the individual department in the year 2017, from the table.
There was no profit from the Electronics department in 2017, thus, we can find the total cost in 2017= 300
Considering the statement 4, we can find the total revenue in 2018 and tabulate the following table.
Profit in 2016 = 200-100= 100
Profit in the electronic department in 2016= 100-30=70
The total profits= for the store in 2016 were from the Electronics department 70%
Question 4
What was the approximate difference in profit percentages of the store in 2017 and 2018?
15.5
25.0
8.3
33.3
Solution:
We can make the following table from the web chart given in the question:
If we consider the total cost in the year
2016 as 100, then according to Statement 1, the total revenue in 2016 must be 200.
The store’s revenue doubled from 2016 to 2017, thus the total revenue in the year 2017 = 400.
We can find the revenue for the individual department in the year 2017, from the table.
There was no profit from the Electronics department in 2017, thus, we can find the total cost in 2017= 300
Considering the statement 4, we can find the total revenue in 2018 and tabulate the following table.
Profit percentage in 2017= (400-300)/300 %= 33.33%
Profit percentage in 2018= (250-200)/200 %= 25%
The approximate difference in profit percentages of the store in 2017 and 2018= (33.33-25)%= 8.33%
Option C.