
CAT 2019Slot 2DILRQuestion & Solution
Data Set
Question 1
Among the students surveyed who supported proposal A, what percentage preferred Sunita for student union president?
Solution:
Total number of students surveyed= 500
Every student prefers one of the two candidates. Ragini(R) and Sunita(S).
Thus, R+S=500.
According to statement 2, "Among the 200 students who preferred Sunita as student union president, 80% supported proposal A."
The number of students who support Sunita(S)=200
The number of students who supported Ragini(R)=300
According to statements 2 and 3, 160 students who supported Sunita also supported the proposal A & 90 students who supported Ragini also supported proposal A.
According to statements 4 and 6, we can make the following Venn diagram for Sunita.
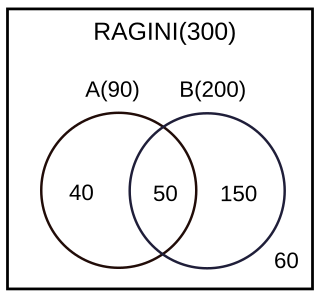
According to statement 5 and 7, we can make the following Venn diagram.
The number of students who preferred Sunita and the proposal A=160
=160/250= 64%
Question 2
What percentage of the students surveyed who did not support proposal A preferred Ragini as student union president?
Solution:
Total number of students surveyed= 500
Every student prefers one of the two candidates. Ragini(R) and Sunita(S).
Thus, R+S=500.
According to statement 2, "Among the 200 students who preferred Sunita as student union president, 80% supported proposal A."
The number of students who support Sunita(S)=200
The number of students who supported Ragini(R)=300
According to statements 2 and 3, 160 students who supported Sunita also supported the proposal A & 90 students who supported Ragini also supported proposal A.
According to statements 4 and 6, we can make the following Venn diagram for Sunita.
According to statement 5 and 7, we can make the following Venn diagram.
The percentage of the students surveyed who did not support proposal A preferred Ragini as student union president = 210/250=84%
Answer 84
Question 3
What percentage of the students surveyed who supported both proposals A and B preferred Sunita as student union president?
40
25
20
50
Solution:
Total number of students surveyed= 500
Every student prefers one of the two candidates. Ragini(R) and Sunita(S).
Thus, R+S=500.
According to statement 2, "Among the 200 students who preferred Sunita as student union president, 80% supported proposal A."
The number of students who support Sunita(S)=200
The number of students who supported Ragini(R)=300
According to statements 2 and 3, 160 students who supported Sunita also supported the proposal A & 90 students who supported Ragini also supported proposal A.
According to statements 4 and 6, we can make the following Venn diagram for Sunita.
According to statement 5 and 7, we can make the following Venn diagram.
According to the Venn diagram, the students surveyed who supported both proposals A and B preferred Sunita as student union president $\frac{50}{50+50}$ % =50%
Question 4
How many of the students surveyed supported proposal B, did not support proposal A and preferred Ragini as student union president?
150
210
200
40
Solution:
Total number of students surveyed= 500
Every student prefers one of the two candidates. Ragini(R) and Sunita(S).
Thus, R+S=500.
According to statement 2, "Among the 200 students who preferred Sunita as student union president, 80% supported proposal A."
The number of students who support Sunita(S)=200
The number of students who supported Ragini(R)=300
According to statements 2 and 3, 160 students who supported Sunita also supported the proposal A & 90 students who supported Ragini also supported proposal A.
According to statements 4 and 6, we can make the following Venn diagram for Sunita.
According to statement 5 and 7, we can make the following Venn diagram.
From the diagram, we can understand that option A is correct.