
CAT 2021Slot 1DILRQuestion & Solution
Data Set
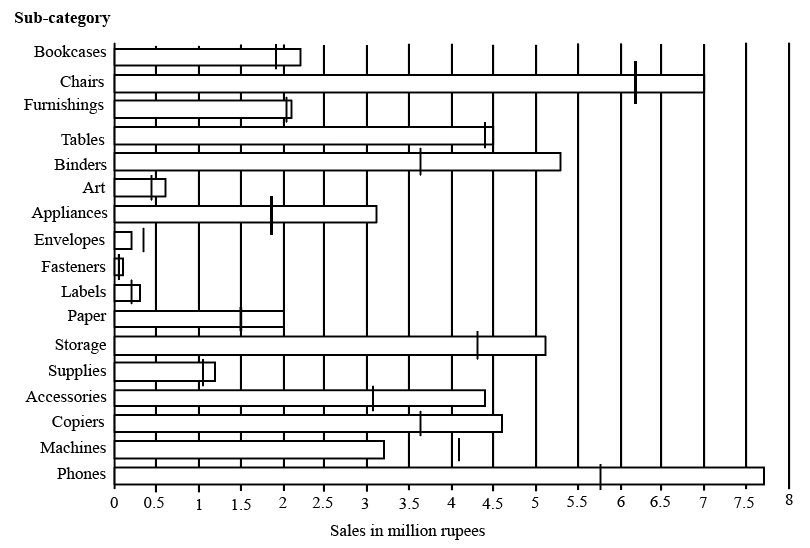
The horizontal bars in the above diagram represent 2020 aggregate sales (in ₹ million) of a company for the different subcategories of its products. The top four product subcategories (Bookcases, Chairs, Furnishings, Tables) belong to furniture product category; the bottom four product subcategories (Accessories, Copiers, Machines, Phones) belong to the technology product category while all other product subcategories belong to the office supply product category. For each of the product subcategories, there is a vertical line indicating the sales of the corresponding subcategory in 2019.
Question 1
The total sales (in ₹ million) in 2019 from products in office supplies category is closest to
18.0
16.5
13.5
12.5
Solution:
The total sales from products in the office supply category in 2019 is :
Sum of sales of :
Binders: 3.6 million
Art : 0.4 million.
Appliances: 1.9 million
Envelops: 0.3 million
Fasteners: 0.1 million
Labels: 0.2 million
Paper = 1.5 million.
Storage: 4.3 million.
Supplies: 1.1 million.
The sum of sales of these products = 3.6+0.4+1.9+0.3+0.1+0.2+1.5+4.3+1.1 = 13.4 million.
The closest among the option is 13.5 million.
Question 2
The percentage increase in sales in Furniture category from 2019 to 2020 is closest to
20%
8%
25%
1%
Solution:
The percentage increase in sales in the furniture category from 2019 to 2020 are :
Bookcases: 1.9 million in 2019 and 2.2 million in 2020.
Chairs: 6.2 million in 2019 and 7 million in 2020.
Furnishings: 2.05 million in 2019 and 2.1 million in 2020.
Tables: 4.4 million in 2019 and 4.5 million in 2020.
Hence the percentage increase is given by :
$\frac{\left(\left(2.2+7+2.1+4.5\right)-\left(1.9+6.2+2.05+4.4\right)\right)}{1.9+6.2+2.05+4.4}$
$\frac{\left(15.8-14.55\right)}{14.55}\cdot100\ =\ \frac{125}{14.55}=\ 8.53\%$
Question 3
How many subcategories had sales of ₹ 4 million or more in 2019 and registered an increase in sales in excess of 25% in 2020?
Solution:
The number of subcategories had sales of ₹ 4 million or more in 2019 and registered an increase in sales in excess of 25% in 2020 :
The subcategories with more than 4 million in sales in 2019 are :
Chairs: 6.2 million in 2019 and 7 million in 2020. ( For a 25 percent increase the sales must be at least 7.8 million and hence fails)
Tables: 4.4 million in 2019 and 4.5 million in 2020. ( For a 25 percent increase the sales must be at least 5.5 million and hence fails)
Storage: 4.3 million sales in 2019 and 5.1 million in 2020. ( For a 25 percent increase the sales must be at least 5.4 and hence fails)
Phones: 5.75 million in 2019 and 7.5 million in 2020. ( An increase of 30.5 percent)
Hence only one subcategory satisfies the condition.
Question 4
The improvement index for a category is the maximum percentage increase in sales from 2019 to 2020 among any of its subcategories. The correct order of categories in increasing order of this improvement index is
furniture, technology, office supply
technology, furniture, office supply
office supply, technology, furniture
office supply, furniture, technology
Solution:
The improvement index for a category is the maximum percentage increase in sales from 2019 to 2020 among any of its subcategories.
Hence based on the information provided in the tabular data we need to look for the different subcategories where the rise in sales from 2019 to 2020 is higher.
Based on the visual data :
In the furniture category :
Bookcases and Chairs have a relatively high percentage increase :
Books cases: 1.9 million to 2.2 million ( 15.7 percent increase )
Chairs: 6.2 million to 7 million ( 12.9 percent increase)
In the office supply category :
Binders and Appliances have a relatively high percentage increase :
Binders: 3.6 million to 5.3 million (47 percent increase )
Appliances: 1.9 million to 3.15 million ( 65.7 percent increase)
In technology product category :
Accessories: 3.1 to 4.4 million. (41.9 percent increase)
Phones: 5.8 million to 7.7 million ( 32.7 percent increase)
Hence among the categories :
The highest increase among them is in the order :
Furniture < Technology product < office supply.