
CAT 2023Slot 3DILRQuestion & Solution
Data Set
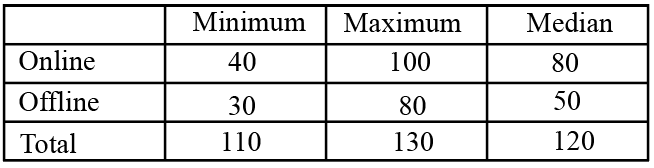
In a coaching class, some students register online, and some others register offline. No student registers both online and offline; hence the total registration number is the sum of online and offline registrations. The following facts and table pertain to these registration numbers for the five months - January to May of 2023. The table shows the minimum, maximum, median registration numbers of these five months, separately for online, offline and total number of registrations. The following additional facts are known.
1. In every month, both online and offline registration numbers were multiples of 10.
2. In January, the number of offline registrations was twice that of online registrations.
3. In April, the number of online registrations was twice that of offline registrations.
4. The number of online registrations in March was the same as the number of offline registrations in February.
5. The number of online registrations was the largest in May.
Question 1
What was the total number of registrations in April?
Solution:
Given that in every month, both online and offline registration numbers were multiples of 10.
From (2), in Jan, the number of offline registrations was twice that of online registrations.
=> If x is number of online registrations => 2x is the number of offline registrations => 3x is the total number of registrations.
According to the data given in the table => 3x should lie between the minimum and maximum total number of registrations. => x = 40 (as x should also be a multiple of 10)
=> In Jan => (40,80) are the online and offline registrations respectively.
Similarly from (3) => In Apr (80,40) are the online and offline registrations respectively.
From-5, the number of online registrations is highest in may => In may there are 100 online registrations. The lowest possible number of offline registrations is 30 and maximum possible total registrations is 130 => In May (100,30) are the online and offline registrations respectively.
Let us assume, 'x' to be the number of offline registrations in May = number of online registrations in March.
Let us capture all this data in a table:
From the table given in the question, 50 is the median for Offline data
=> x should lie between 50 and 80 (included)
For 80 to be the median for the online data => y lie between 80 and 100 (included).
Now, consider Feb => Minimum value of y + x = 80 + 50 = 130 (which is the maximum value possible of the total possible registrations)
=> x = 50 and y = 80
Since, 110 is the minimum number of total registrations, the only possibility is in March => 50 + z = 110 => z = 60.
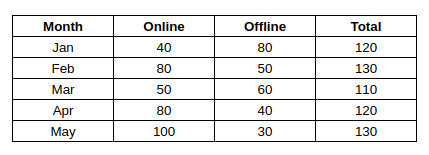
Now, filling the complete table we get,
The total number of registrations in April is 120.
Question 2
What was the number of online registrations in January?
Solution:
Given that in every month, both online and offline registration numbers were multiples of 10.
From (2), in Jan, the number of offline registrations was twice that of online registrations.
=> If x is number of online registrations => 2x is the number of offline registrations => 3x is the total number of registrations.
According to the data given in the table => 3x should lie between the minimum and maximum total number of registrations. => x = 40 (as x should also be a multiple of 10)
=> In Jan => (40,80) are the online and offline registrations respectively.
Similarly from (3) => In Apr (80,40) are the online and offline registrations respectively.
From-5, the number of online registrations is highest in may => In may there are 100 online registrations. The lowest possible number of offline registrations is 30 and maximum possible total registrations is 130 => In May (100,30) are the online and offline registrations respectively.
Let us assume, 'x' to be the number of offline registrations in May = number of online registrations in March.
Let us capture all this data in a table:
From the table given in the question, 50 is the median for Offline data
=> x should lie between 50 and 80 (included)
For 80 to be the median for the online data => y lie between 80 and 100 (included).
Now, consider Feb => Minimum value of y + x = 80 + 50 = 130 (which is the maximum value possible of the total possible registrations)
=> x = 50 and y = 80
Since, 110 is the minimum number of total registrations, the only possibility is in March => 50 + z = 110 => z = 60.
Now, filling the complete table we get,
The number of online registrations in Jan is 40.
Question 3
Which of the following statements can be true?
I. The number of offline registrations was the smallest in May.
II. The total number of registrations was the smallest in February.
Both I and II
Only II
Neither I nor II
Only I
Solution:
Given that in every month, both online and offline registration numbers were multiples of 10.
From (2), in Jan, the number of offline registrations was twice that of online registrations.
=> If x is number of online registrations => 2x is the number of offline registrations => 3x is the total number of registrations.
According to the data given in the table => 3x should lie between the minimum and maximum total number of registrations. => x = 40 (as x should also be a multiple of 10)
=> In Jan => (40,80) are the online and offline registrations respectively.
Similarly from (3) => In Apr (80,40) are the online and offline registrations respectively.
From-5, the number of online registrations is highest in may => In may there are 100 online registrations. The lowest possible number of offline registrations is 30 and maximum possible total registrations is 130 => In May (100,30) are the online and offline registrations respectively.
Let us assume, 'x' to be the number of offline registrations in May = number of online registrations in March.
Let us capture all this data in a table:
From the table given in the question, 50 is the median for Offline data
=> x should lie between 50 and 80 (included)
For 80 to be the median for the online data => y lie between 80 and 100 (included).
Now, consider Feb => Minimum value of y + x = 80 + 50 = 130 (which is the maximum value possible of the total possible registrations)
=> x = 50 and y = 80
Since, 110 is the minimum number of total registrations, the only possibility is in March => 50 + z = 110 => z = 60.
Now, filling the complete table we get,
1) In May, there are 30 offline registrations (smallest) => True
2) In Mar, we have smallest number of total registrations => False.
Question 4
What best can be concluded about the number of offline registrations in February?
80
50 or 80
30 or 50 or 80
50
Solution:
Given that in every month, both online and offline registration numbers were multiples of 10.
From (2), in Jan, the number of offline registrations was twice that of online registrations.
=> If x is number of online registrations => 2x is the number of offline registrations => 3x is the total number of registrations.
According to the data given in the table => 3x should lie between the minimum and maximum total number of registrations. => x = 40 (as x should also be a multiple of 10)
=> In Jan => (40,80) are the online and offline registrations respectively.
Similarly from (3) => In Apr (80,40) are the online and offline registrations respectively.
From-5, the number of online registrations is highest in may => In may there are 100 online registrations. The lowest possible number of offline registrations is 30 and maximum possible total registrations is 130 => In May (100,30) are the online and offline registrations respectively.
Let us assume, 'x' to be the number of offline registrations in May = number of online registrations in March.
Let us capture all this data in a table:
From the table given in the question, 50 is the median for Offline data
=> x should lie between 50 and 80 (included)
For 80 to be the median for the online data => y lie between 80 and 100 (included).
Now, consider Feb => Minimum value of y + x = 80 + 50 = 130 (which is the maximum value possible of the total possible registrations)
=> x = 50 and y = 80
Since, 110 is the minimum number of total registrations, the only possibility is in March => 50 + z = 110 => z = 60.
Now, filling the complete table we get,
The number of offline registrations in Feb is 50.
Question 5
Which pair of months definitely had the same total number of registrations?
I. January and April
II. February and May
Both I and II
Only II
Only I
Neither I nor II
Solution:
Given that in every month, both online and offline registration numbers were multiples of 10.
From (2), in Jan, the number of offline registrations was twice that of online registrations.
=> If x is number of online registrations => 2x is the number of offline registrations => 3x is the total number of registrations.
According to the data given in the table => 3x should lie between the minimum and maximum total number of registrations. => x = 40 (as x should also be a multiple of 10)
=> In Jan => (40,80) are the online and offline registrations respectively.
Similarly from (3) => In Apr (80,40) are the online and offline registrations respectively.
From-5, the number of online registrations is highest in may => In may there are 100 online registrations. The lowest possible number of offline registrations is 30 and maximum possible total registrations is 130 => In May (100,30) are the online and offline registrations respectively.
Let us assume, 'x' to be the number of offline registrations in May = number of online registrations in March.
Let us capture all this data in a table:
From the table given in the question, 50 is the median for Offline data
=> x should lie between 50 and 80 (included)
For 80 to be the median for the online data => y lie between 80 and 100 (included).
Now, consider Feb => Minimum value of y + x = 80 + 50 = 130 (which is the maximum value possible of the total possible registrations)
=> x = 50 and y = 80
Since, 110 is the minimum number of total registrations, the only possibility is in March => 50 + z = 110 => z = 60.
Now, filling the complete table we get,
Total registrations in Jan = Apr = 120 and Feb = May = 130.