
CAT 2024Slot 2DILRQuestion & Solution
Data Set
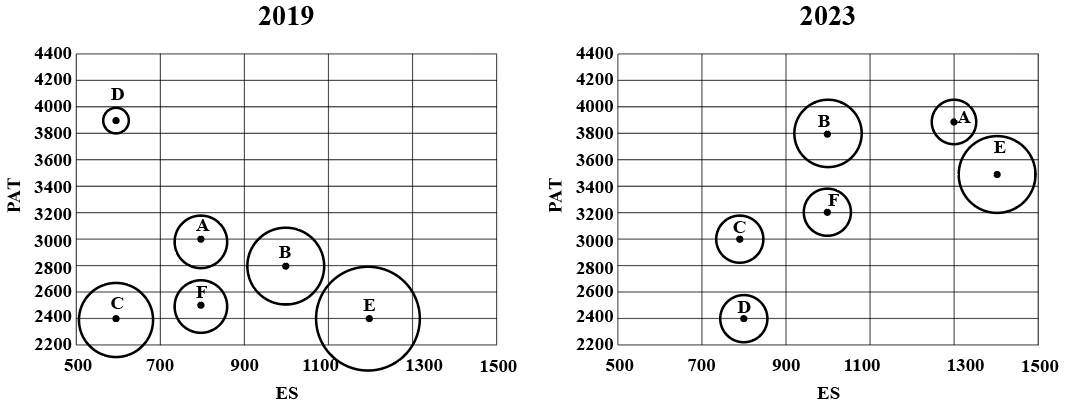
The two plots below give the following information about six firms A, B, C, D, E, and F for 2019 and 2023.
PAT: The firm’s profits after taxes in Rs. crores,
ES: The firm’s employee strength, that is the number of employees in the firm, and
PRD: The percentage of the firm’s PAT that they spend on Research and Development (R&D).
In the plots, the horizontal and vertical coordinates of point representing each firm gives their ES and PAT values respectively. The PRD values of each firm are proportional to the areas around the points representing each firm. The areas are comparable between the two plots, i.e., equal areas in the two plots represent the same PRD values for the two years.
Question 1
Assume that the annual rate of growth in PAT over the previous year (ARG) remained constant over the years for each of the six firms. Which among the firms A, B, C, and E had the highest ARG?
Firm A
Firm C
Firm E
Firm B
Solution:
Since we are given that the annual growth rate should be taken as constant, we can simply compare the ratio changes in the firm's PAT in 2019 and 2023 and compare them.
Firm A: 3000 to 3900; an increase of 900, giving the growth rate to be $\frac{900}{3000}=\frac{3}{10}=0.3$
Firm C: 2400 to 3000; an increase of 600, giving the growth rate to be $\frac{600}{2400}=\frac{1}{4}=0.25$
Firm E: 2400 to 3500; an increase of 1100, giving the growth rate to be $\frac{1100}{2400}=\frac{11}{24}\approx\ 0.45$
Firm B: 2800 to 3800; an increase of 1000, giving the growth to be $\frac{1000}{2800}=\frac{5}{14}\approx\ 0.35$
We can see that of the given ratios, the growth rate is highest for firm E (closest to 0.5). Therefore, the highest ARG, among the given options, will be for firm E.
Therefore, Option C is the correct answer.
Question 2
The ratio of the amount of money spent by Firm C on R&D in 2019 to that in 2023 is closest to
9 : 4
5 : 6
5 : 9
9 : 5
Solution:
This can be a little difficult to solve since the bubbles are not closed within a fixed boundary, but in such instances, we should approximate the most visible cases.
Like the bubble of C in 2019 is almost 3 units vertically long in diameter, while that in 2023 is 2 units long.
The ratio of the amount spend on R&D on 2019 to 2024 would be given by: $\frac{2400\pi\left(1.5\right)^2\ }{3000\pi\ \left(1\right)^2}=\frac{8}{10}\times\ \frac{9}{4}=9:5$
Which is option D.
Question 3
Which among the firms A, C, E, and F had the maximum PAT per employee in 2023?
Firm E
Firm A
Firm F
Firm C
Solution:
The Pat per employee for the firm in 2023 will be:
Firm E:$\frac{3500}{1400}=\frac{35}{14}=\frac{5}{2}$
Firm A: $\frac{3900}{1300}=3$
Firm F: $\frac{3200}{1000}=3.2$
Firm C: $\frac{3000}{800}=\frac{15}{4}=3.75$
The value if maximum for firm C, therefore, Option D is the correct answer.
Question 4
Which among the firms C, D, E, and F had the least amount of R&D spending per employee in 2023?
Firm F
Firm D
Firm C
Firm E
Solution:
We calculated the PAT per employee for F, C and E in the last question, using that information and calculating the PAT per employee for firm D to be $\frac{2400}{800}=3$
For firms F, C and D, we can see that the area is the same hence the only factor to consider is PAT per employee
F is 3.2, C is 3.75, and D is 3
This leaves D as the minimum.
Comparing E and D (taking the proportionality constant as k)
E has PAT per employee as 2.5 with a radius of 1.5 units, the PRD value per employee would be $\frac{5}{2}k\pi\ \left(\frac{3}{2}\right)^2=k\pi\ \times\ \frac{5\times\ 9}{8}$
D has PAT per employee as 3, with a radius of 1 unit.the PRD value per employee would be $3k\pi (1)^2 = 3k\pi$
We can see that the value would be greater for E, therefore firm D will have the lowest R&D spending per employee in 2023
Therefore, Option B is the correct answer.